4. Map viewer
A user-friendly interface that is easy to navigate and allows users to view and interact with maps in real-time. It has the ability to display multiple layers of geospatial data, such as satellite imagery, street maps, and demographic data.
Main features
Tools for zooming in and out of maps and panning to different areas of interest.
Functions for searching for specific locations or addresses, as well as tools for navigating maps using tools such as a compass or a scale bar.
Interactive features such as pop-up windows, highlighting, and querying of data layers.
Ability to share maps with others by sharing a link to the map viewer.
Compatibility with mobile devices, allowing users to view maps on-the-go using smartphones and tablets.
Secure access to the map viewer, with options for user authentication and authorization.
4.1. Working with projects
The maps created in the administration interface are called projects. Access rights can be granted to projects and the layers on them. This allows to control, for example, whether a map or its layers should be public or which teams can edit the content of certain layers (digitizing, edit attributes, upload images / attachments).
As a first step, the project selection screen will appear. You can call this up later using the project selector in the toolbar. After loading the selected project, the map viewer will be initialized.
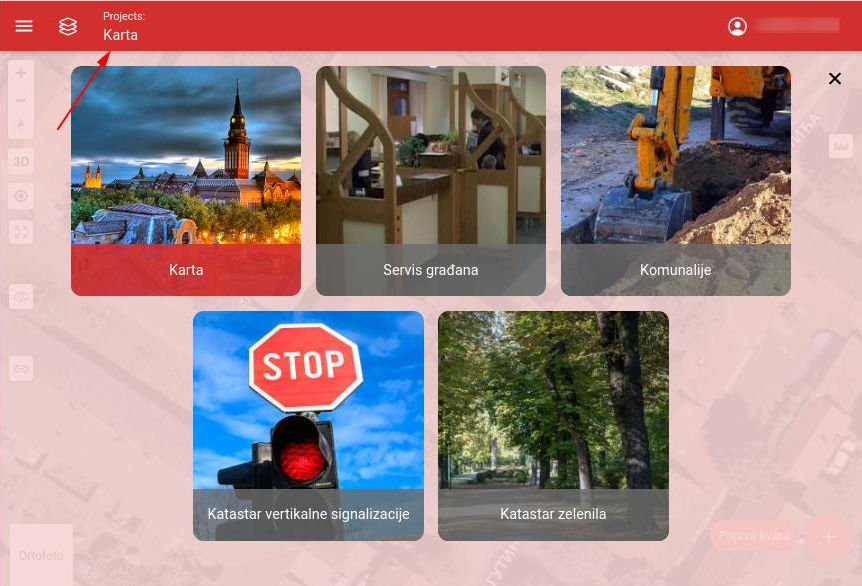
Project selection screen
4.2. Viewport
A large area dedicated to displaying the map and its data layers, taking up the majority of the application window. It contains toolbars and menus that provide access to the map’s various functions and tools, such as zooming, panning, measuring, digitizing.
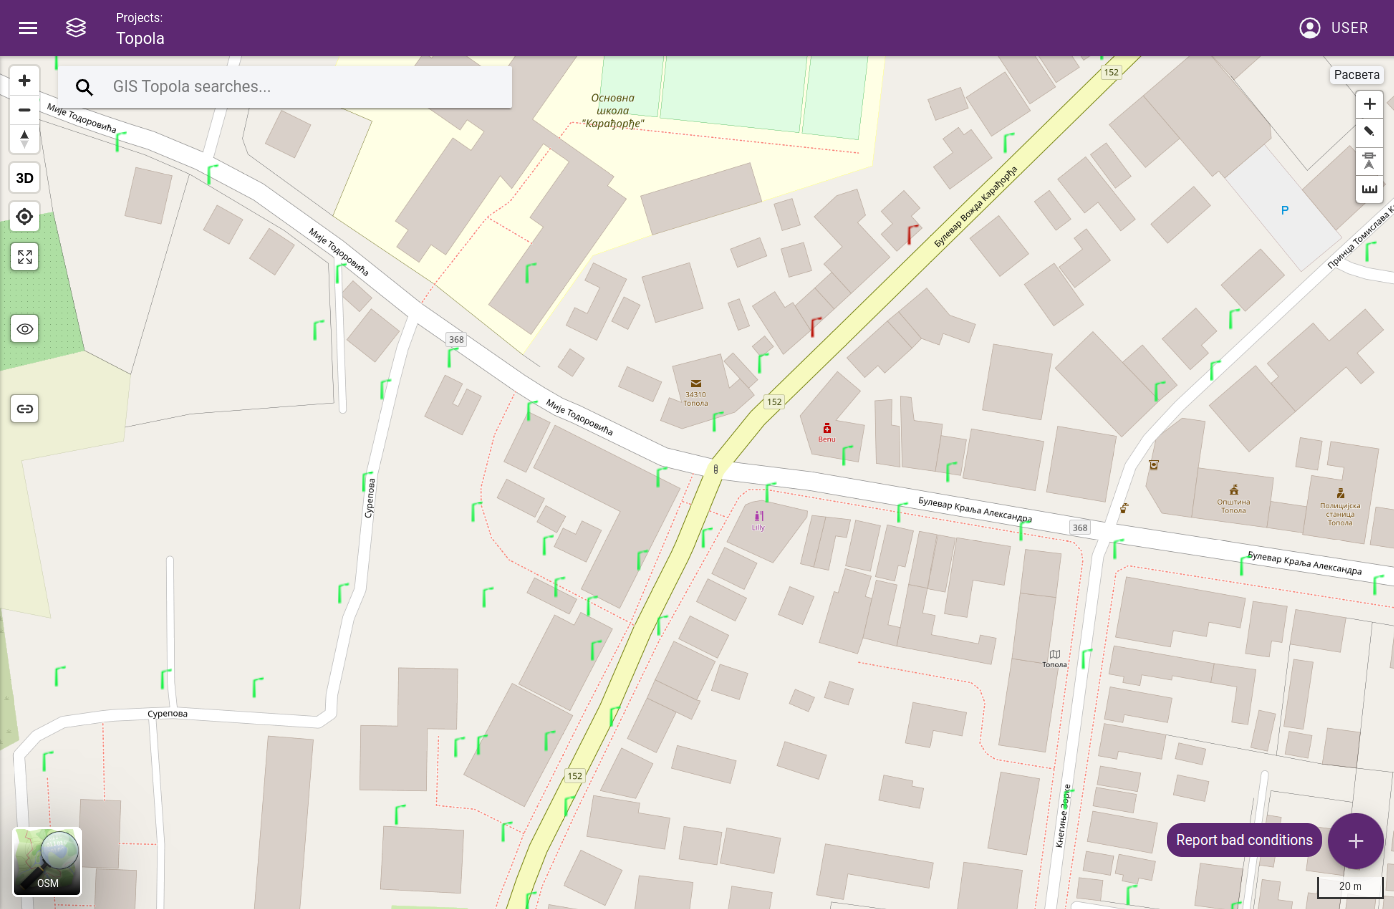
Map view
Tools:
Search bar: Search can be executed with a keyword. After the search, results will be displayed in a dropdown menu (maximum of 100 items) and pins will be placed on the map. When a result is selected from the list, map will be focused on the result’s pin.
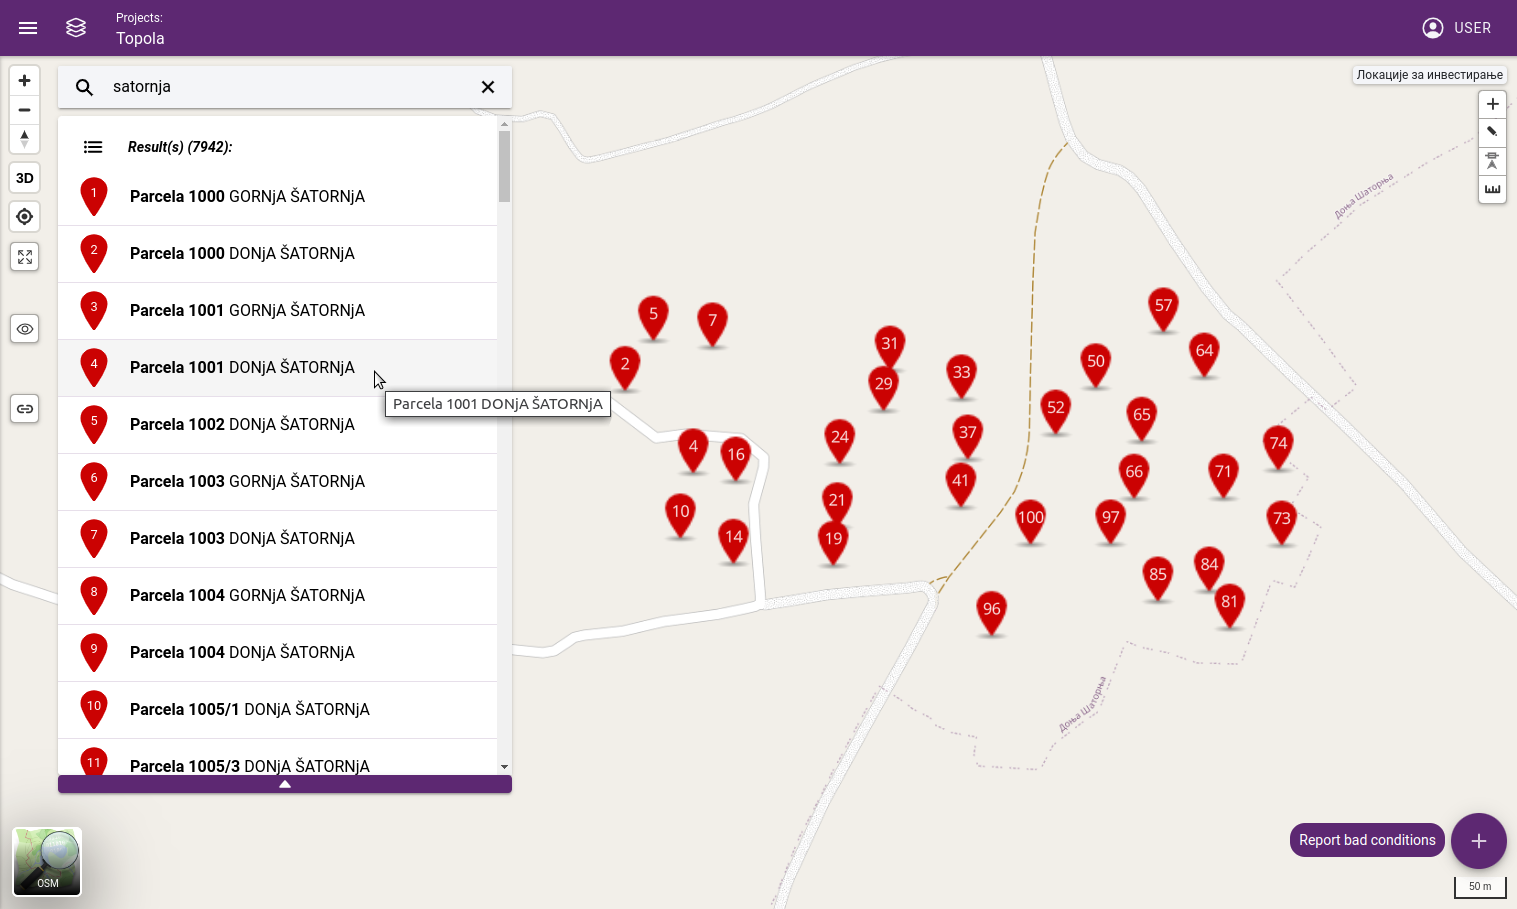
Search results
Zoom in and out: “+” zooms in and the “-” button zooms out the map.
Reset map orientation: If the map is previously rotated (press and hold the right mouse button), its orientation can be reset to the default north-facing position.
3D view: This function is used with a 3D layer. First, check a 3D object layer, and activate the tool.
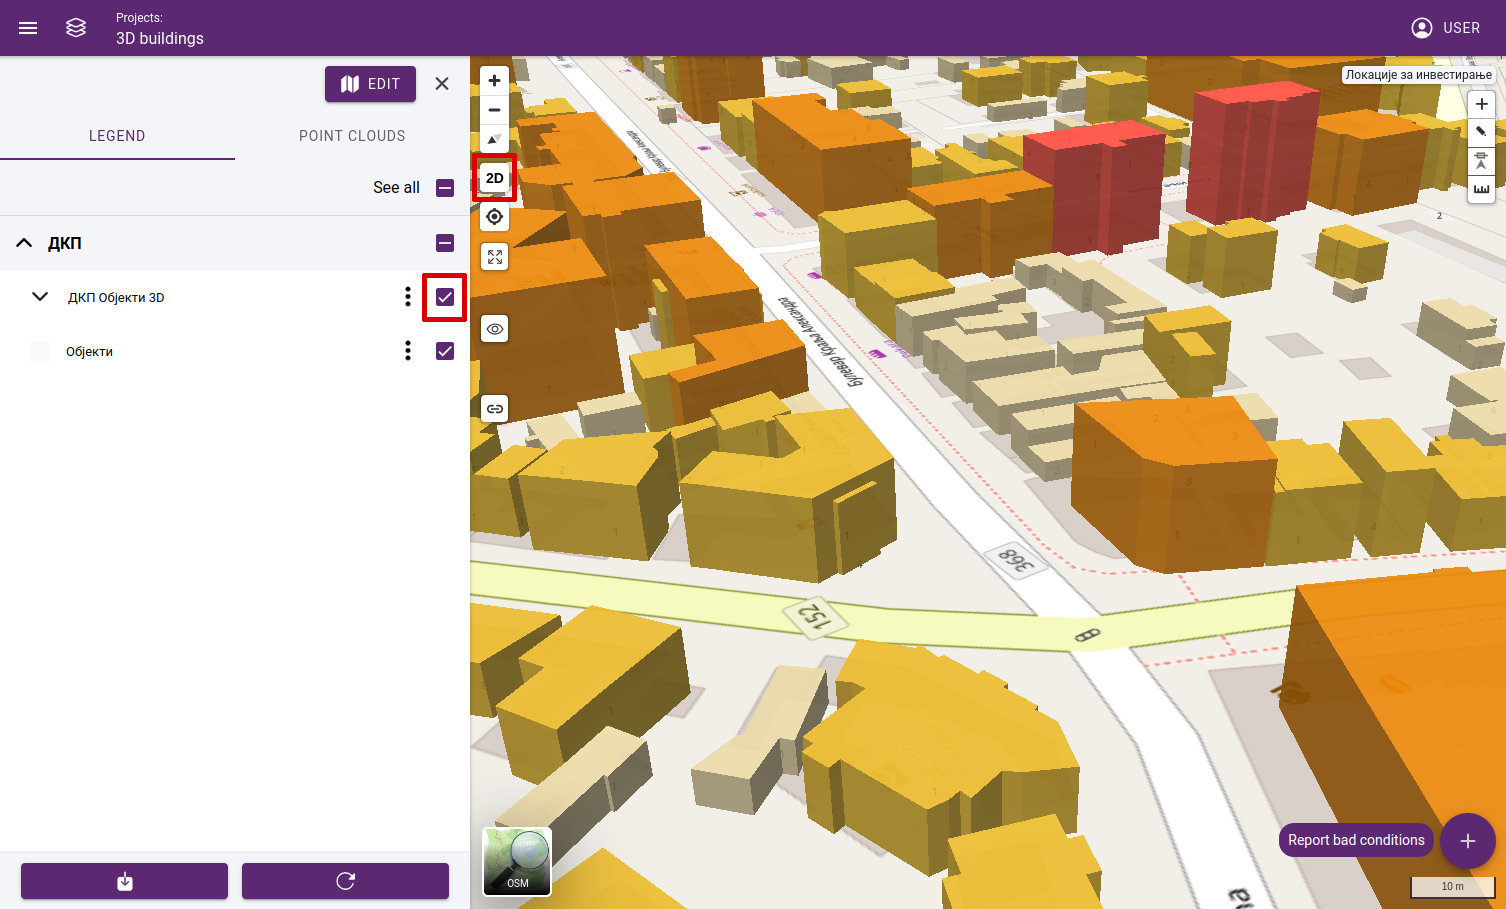
3D view
Find my location: Map will be focused on the user’s aproximate geolocation.
Zoom to extent: Map zoom level and position will be reset to its default values.
Open point cloud: Drag and drop the tool on the map to open its location in the point cloud map.
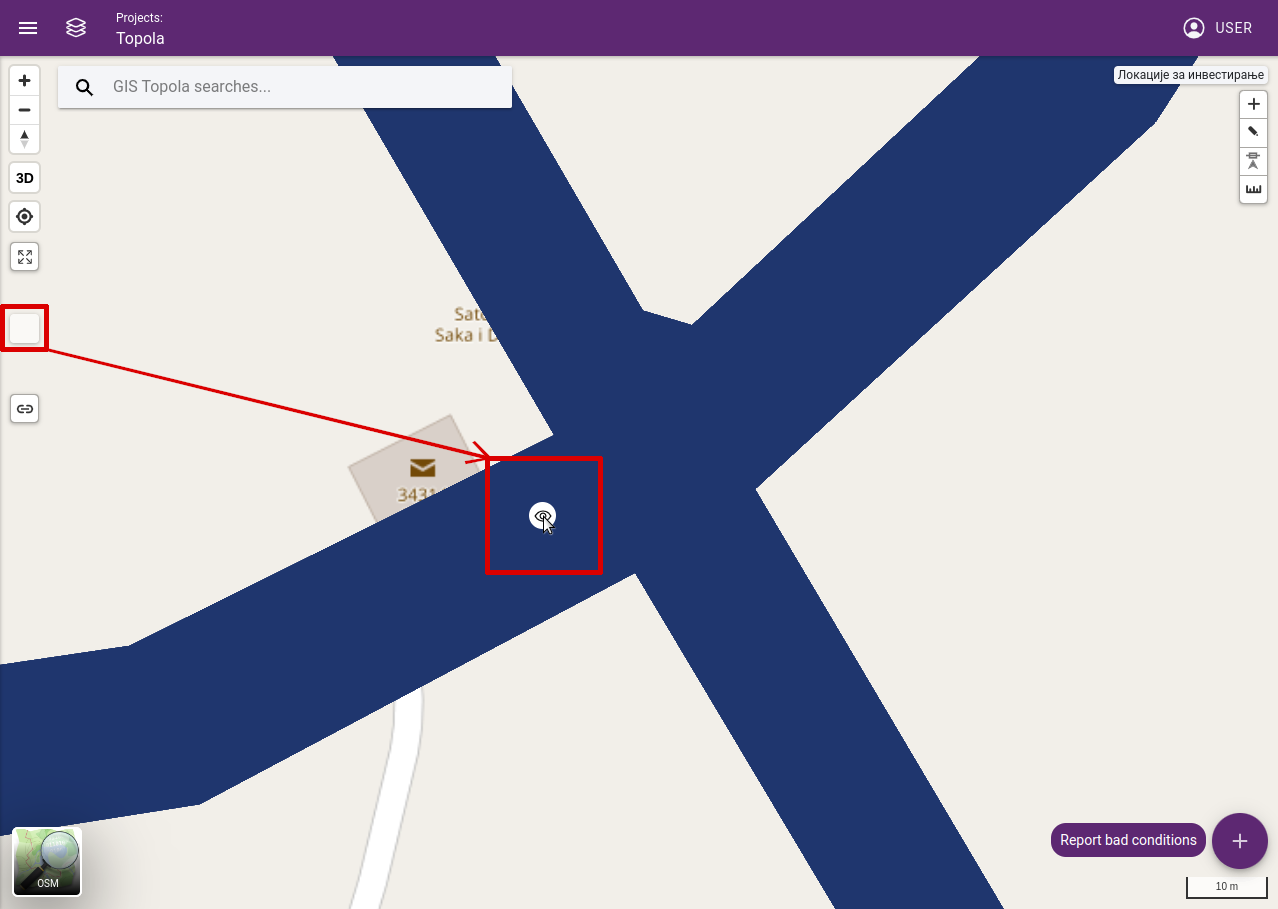
Dragging eye to point cloud coverage area
Get permalink: Current location on the map can be converted in a link format copied
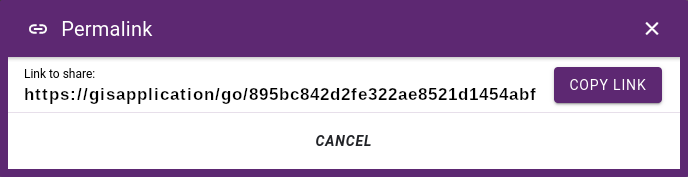
Permalink
Basemap selector: The current map type can be changed.
2D digitizing tools: These tools are available when the active layer is set. Objects on the map can be created, edited or its properties changed.
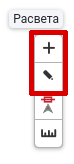
More about the 2D tools can be found here: 2d tools
Snap tool: Snap tool is used with the 2D digitizing tools or with the measurement tool. It can be:
set to snap to the objects edges.
set to snap to the objects endpoints.
set to snap to the objects edges and endpoints.
turned off.
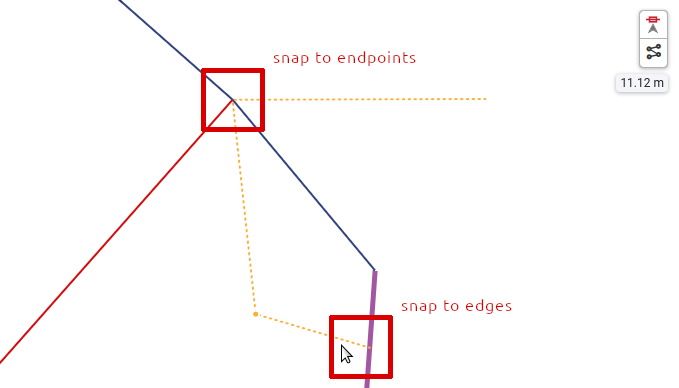
The snap tool in action
Measuremant tools: Different measuring tools can be used to measure area or distance. Measurements can be taken by selecting the desired tool and clicking on the map. Measurements can be completed by double-clicking on the map.
Measure distance: Distance is measured between multiple points, minimum of two.
Measure area: Area is measured between multiple points, minimum of three.
Turn off: Disable the measurement tool and clear all measurements on the map.
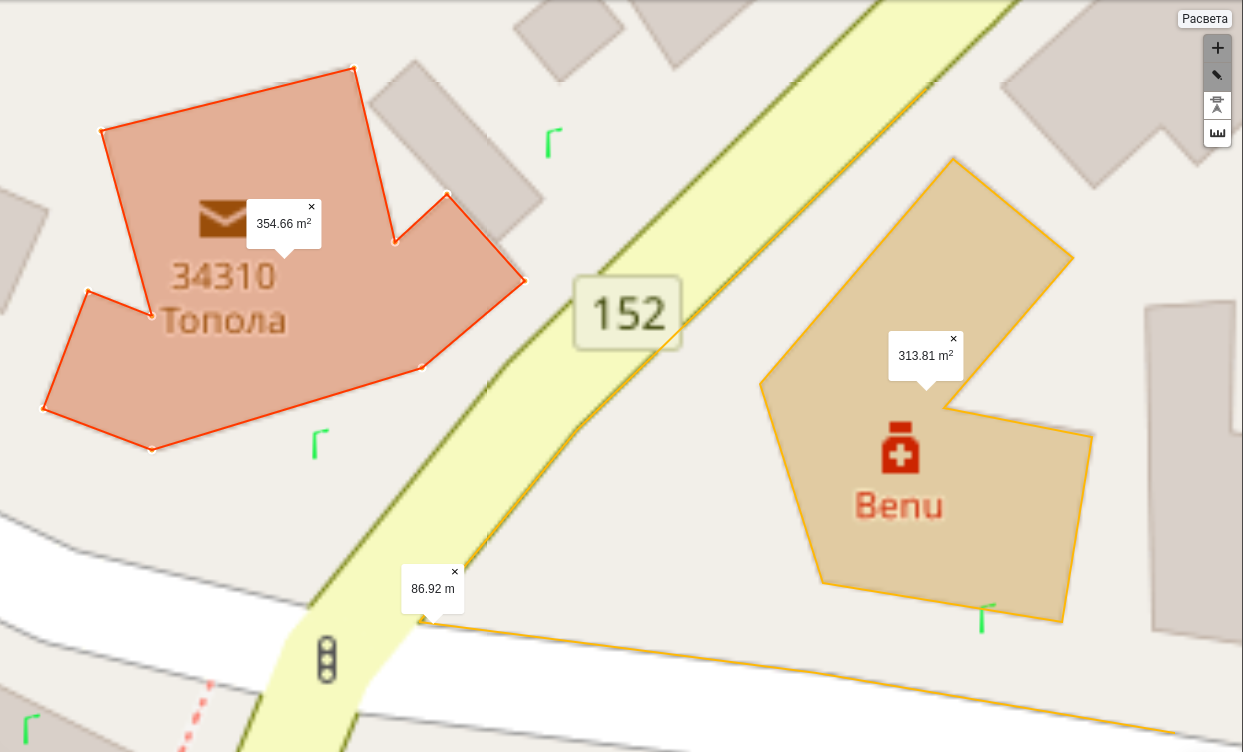
Measuring area and distance
Report bad conditions: A report can be created in three category, it can be a road sign, lighting, muncipial or road defect. When a category is selected it can be created when clicked on the map, then a popup is opened where the defect details can be defined. This is an optional feature. When preparing a report, it can be created on an existing layer as an object, or it can be attached to an existing object as a report document.
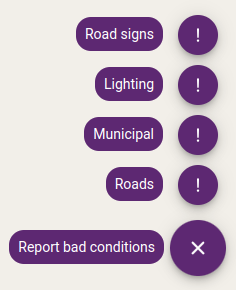
Fault reports
For example if a road lighting defect has to be reported:
First the “lighting” tool must be selected under “report bad conditions”.
When the tool is activated, the lighting layer (on this layer all lighting objects are defined) is set as the active layer.
To report a problem select a lighting object on the map.
When the object is selected the object’s form is opened on the “report bad conditions” tab.
Fill the required fields like type of defect, contact number, comment and save the report.
Map scale bar: Scale bars provide a visual indication of distance and feature size on the map. Scale bar updates on every zoom level.
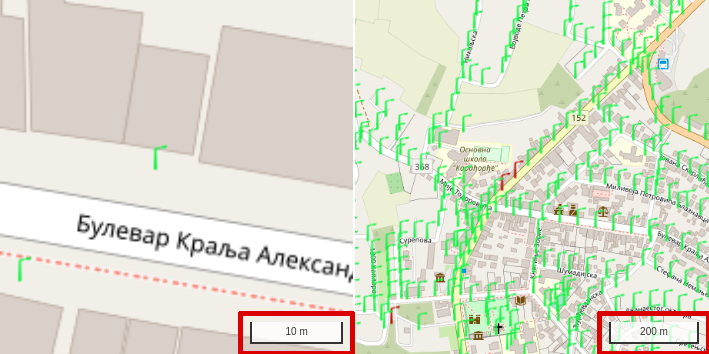
Scale bar in different zoom levels
4.3. Basemap selector
A basemap is a background map that provides context and reference for the data being analyzed, making it easier to understand the relationships between data and geography.
Basemaps can be assembled in map editor or added from public services like OpensStreetmap tiles or WMS services - see Basemap administration section.
If multiple basemaps are assigned to a project, you can switch between them using the basemap selector.
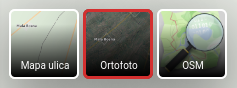
Basemap selector
4.4. Map legend
The map legend list available layers for the current project, displays the symbology used for each data layer and allows users to turn layers on and off. Layers can be switched on and off at several levels:
switch on/off all layers on the map
switch on/off all layers in a folder
switch on/off a layer
switch on/off a layer class
Tip
Vector layers can be classified by attribute, and these classes are also shown in the map legend. It is possible to display only the features belonging to the selected classes.
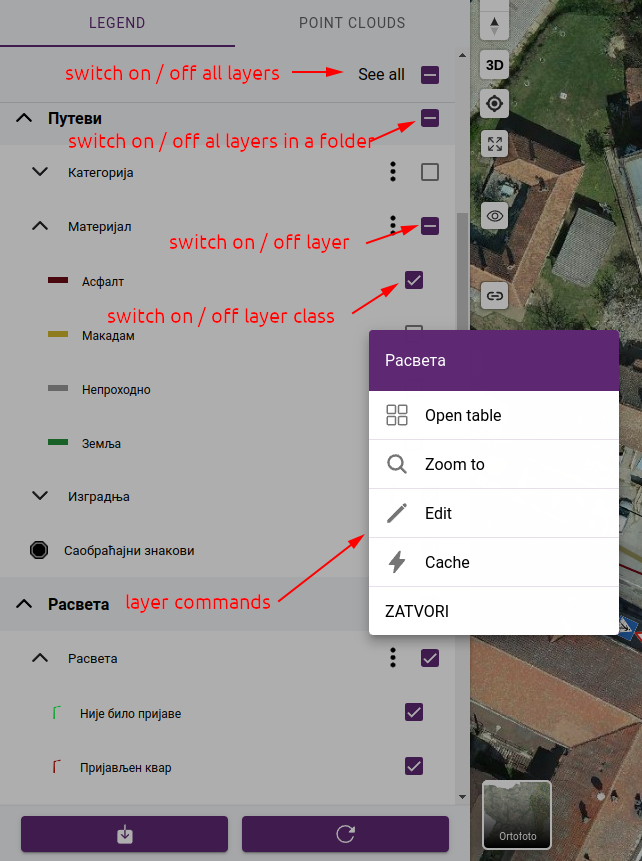
Layers
The layers pop-up menu contains the following commands:
Open table - opens attribute table. Available only for editable layers.
Zoom to - zooms to the layer’s extent. Available after the layer has been loaded.
Edit - navigates to layer editor page. Available for users with edit permissions on the selected layer.
Cache - opens the cache manipulation panel. Available for users with edit permissions on the selected layer.
If point clouds are attached to the project, the map legend will be extended with a list of available point clouds. In addition to toggling point clouds on and off, you can zoom in on the area they cover, or zoom in on the area of all the point clouds in a folder.
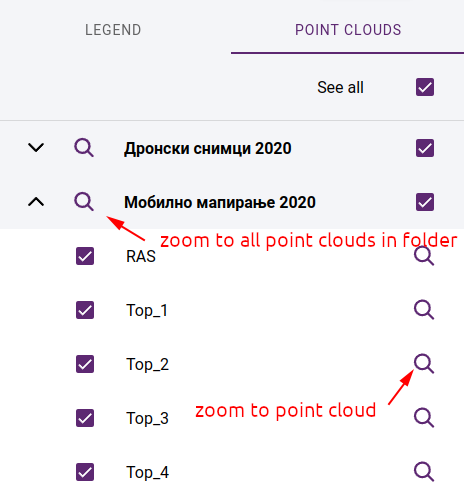
Point clouds
At the bottom of maplegend are the export and reload layers functions
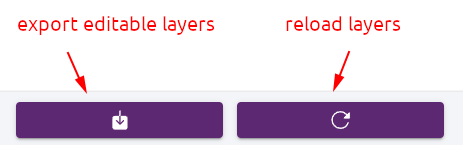
Export / refresh
4.5. Export data
You can populate layers marked as editable in the application, using the digitizing tools and forms. These layers can be exported from the database.
The layers can be exported in GIS, CAD and spreadsheet formats:
.shp - ESRI ShapeFile
.gdb - File Geodatabase (GDB)
.dxf - Autocad DXF
.csv - Comma Separated list (CSV)
.xlsx - MS Excel
Note
Formats .csv and .xlsx are exporting only the attribute table without spatial data.
In addition to the layer data, it is also possible to export the assigned images and attachments. You can choose to export all or only the active layers. If point clouds are available, it is possible to limit the export to the area covered by the point clouds that are connected.
Note
Export is available only for logged in users. Only those layers are exported for which the user has export permission. The permissions can be set by the project owner or an administrator on the map administration pages.
Since we can export a lot of large layers, exporting can take some time. To avoid waiting for the result, you can choose the notification option. In this case, you can continue working and receive a notification email with a download link after the export is complete.
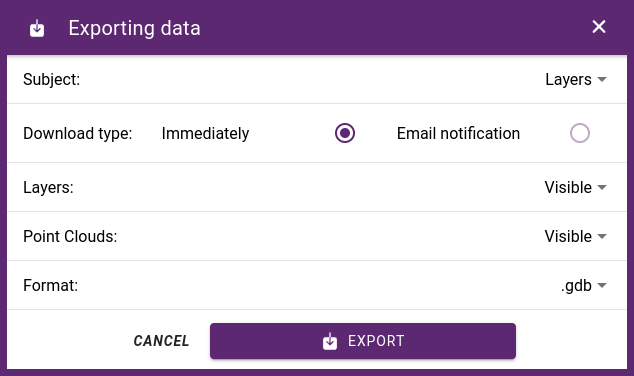
Layer export dialog